
Investing for Geniuses
Data Science and Mathematics in Investing
We present a series of studies that exemplify our approach to investment, which is grounded in the application of mathematical and data science principles. The showcased studies are intended to demonstrate the effectiveness of our methods and the results we have achieved in the field of investment.
Becoming an Investor
Our exemplary investment results speak for themselves. By investing in our company, you gain the unique opportunity to benefit directly from our advanced research and proven strategies. We welcome investors who are eager to engage, share their insights, and help steer the company towards new levels of success.
Join Our Company
We are also looking for individuals with a strong background in mathematics and data science to join our board. If you are interested in helping shape the future of our company, contact us today.
Equity Risk Sciences introduces Alpha Algorithmics X-Factor™
We seek joint ventures with hedge funds, family offices, insurance companies and brokerage firms.
Alpha Algorithmics X-Factor™ – 1-Year Study
Average 6-month return: 25.8%
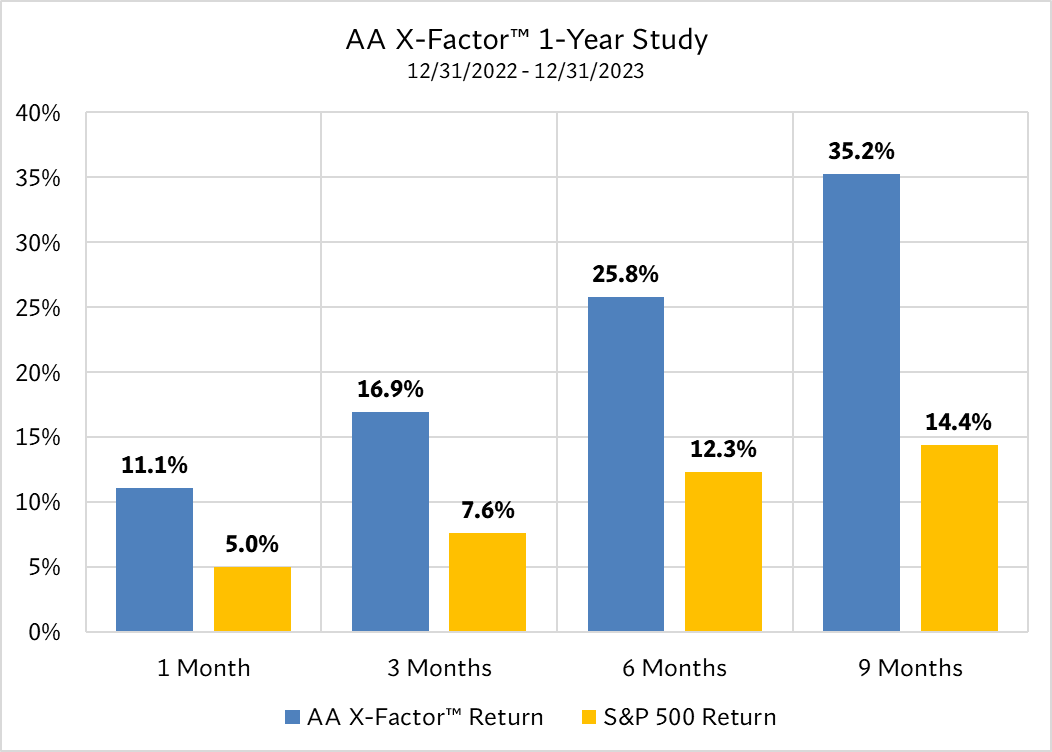
| Hold Period |
# of Co’s |
AA X-Factor™ Return |
S&P 500 Return |
| 1 Month | 33 | 11.1% | 5.0% |
| 3 Months | 32 | 16.9% | 7.6% |
| 6 Months | 29 | 25.8% | 12.3% |
| 9 Months |
19 | 35.2% | 14.4% |
Alpha Algorithmics X-Factor™ – 2-Year Study
Average 1-year return: 33.4%
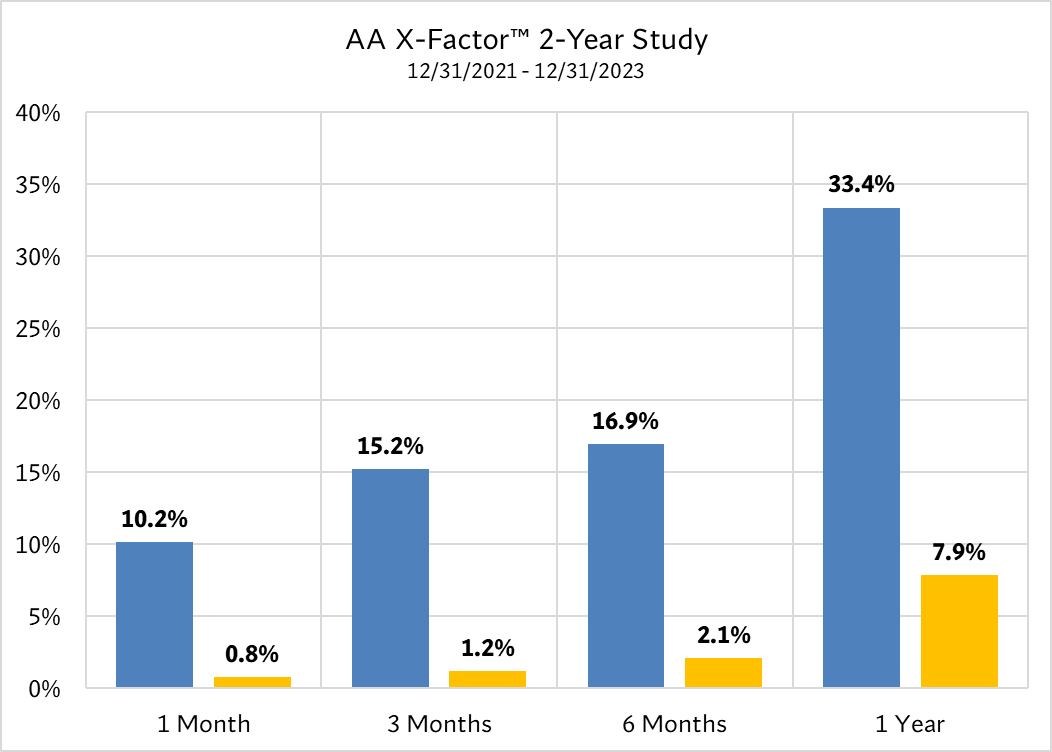
| Hold Period |
# of Co’s |
AA X-Factor™ Return |
S&P 500 Return |
| 1 Month | 49 | 10.4% | 0.8% |
| 3 Months | 48 | 15.2% | 1.3% |
| 6 Months | 46 | 16.9% | 2.1% |
| 1 Year |
32 | 33.4% | 7.9% |
Alpha Algorithmics X-Factor™ – 3-Year Study
Average 1-year return: 31.5%
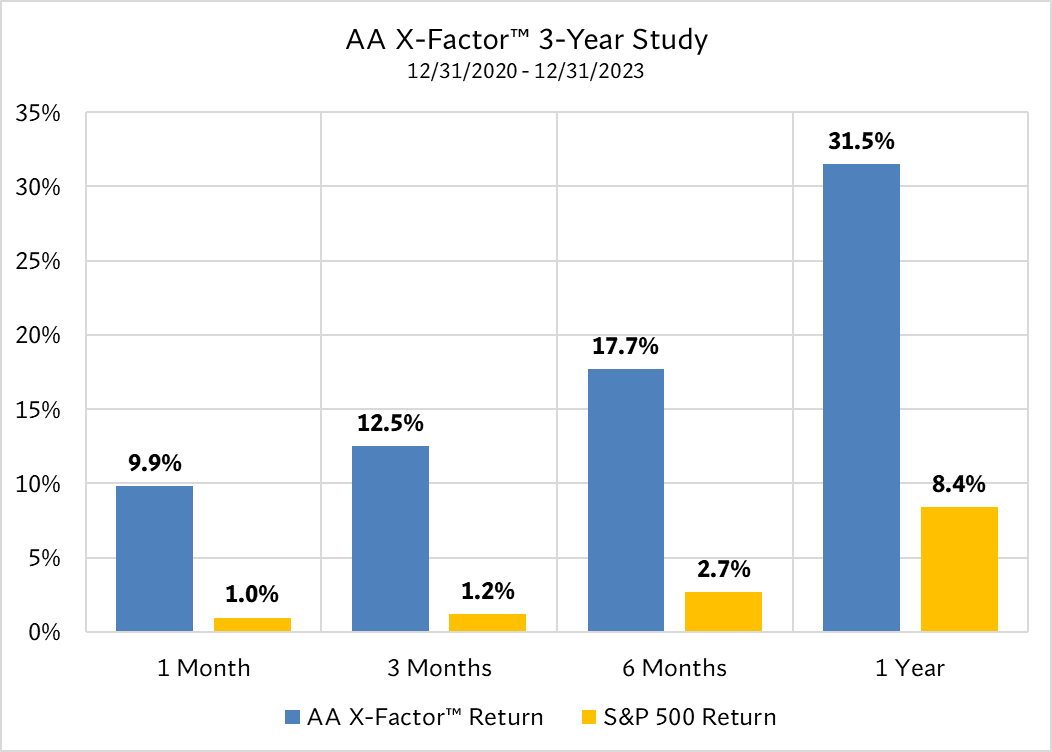
| Hold Period |
# of Co’s |
AA X-Factor™ Return |
S&P 500 Return |
| 1 Month | 51 | 9.9% | 1.0% |
| 3 Months | 50 | 12.5% | 1.2% |
| 6 Months | 48 | 17.7% | 2.7% |
| 1 Year | 34 | 31.5% | 8.4% |
Alpha Algorithmics X-Factor™ – 5-Year Study
Average 1-year return: 159.7%
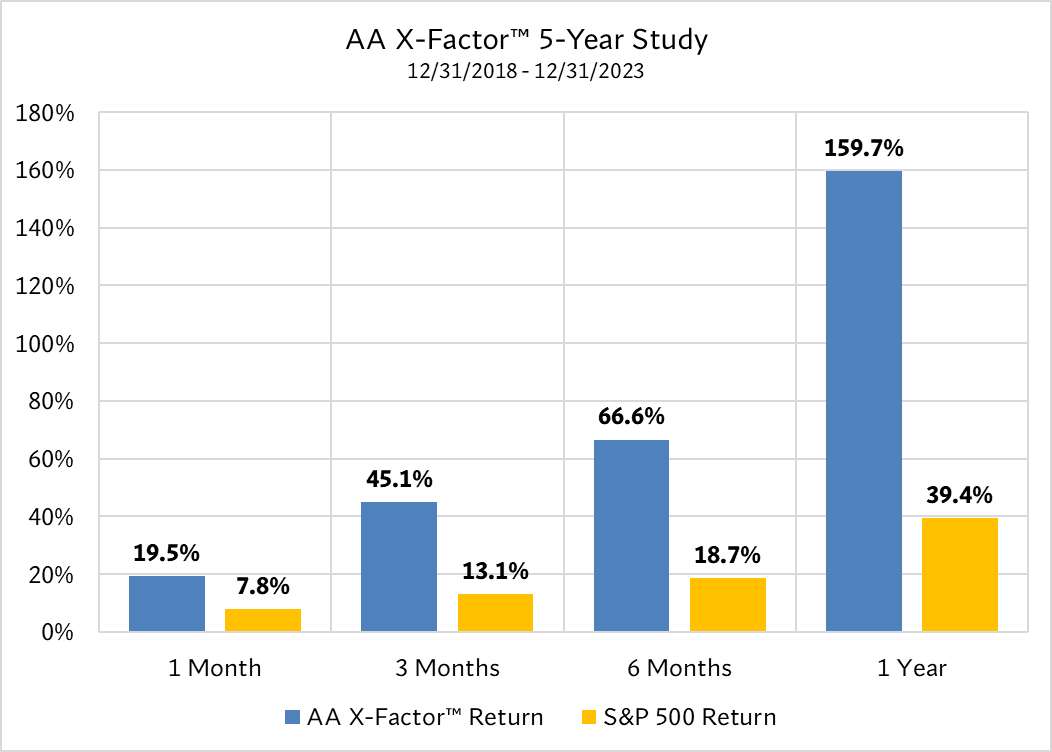
| Hold Period |
# of Co’s |
AA X-Factor™ Return |
S&P 500 Return |
| 1 Month | 68 | 19.5% | 7.8% |
| 3 Months | 67 | 45.1% | 13.1% |
| 6 Months | 66 | 66.6% | 18.7% |
| 1 Year | 53 | 159.7% | 39.4% |
Alpha Algorithmics X-Factor™ – 10-Year Study
Average 1-year return: 123.1%
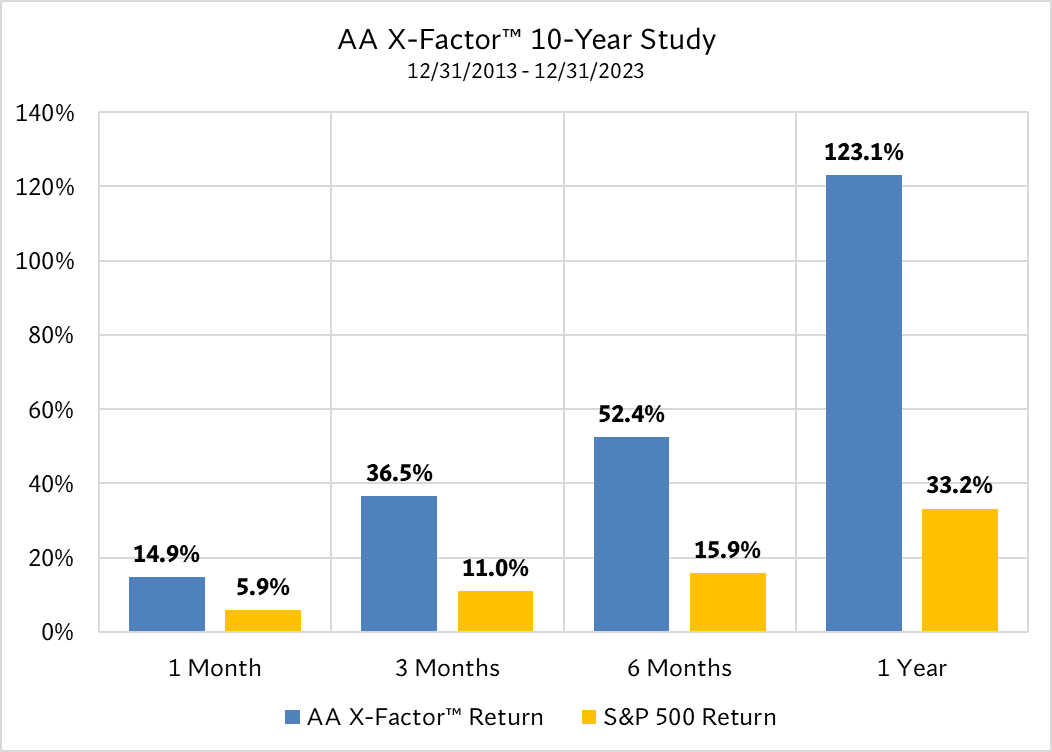
| Hold Period |
# of Co’s |
AA X-Factor™ Return |
S&P 500 Return |
| 1 Month | 79 | 14.9% | 5.9% |
| 3 Months | 78 | 36.5% | 11.0% |
| 6 Months | 77 | 52.4% | 15.9% |
| 1 Year | 65 | 123.1% | 33.2% |
Alpha Algorithmics X-Factor™ – 15-Year Study
Average 1-year return: 103.3%
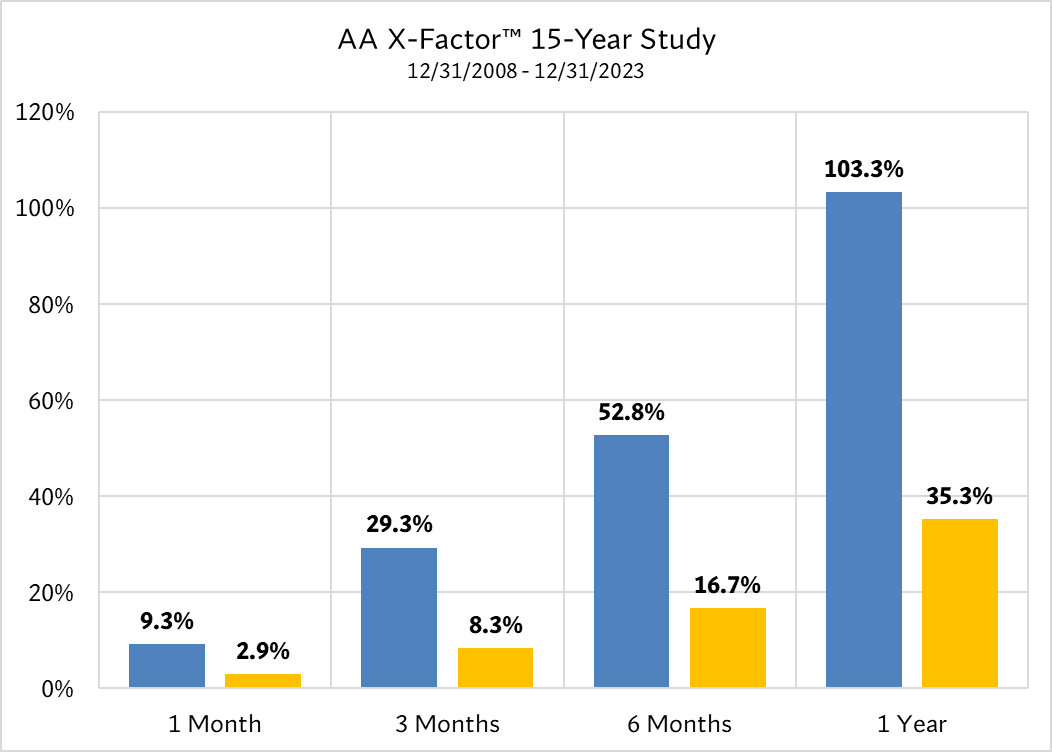
| Hold Period |
# of Co’s |
AA X-Factor™ Return |
S&P 500 Return |
| 1 Month | 148 | 9.3% | 2.9% |
| 3 Months | 147 | 29.3% | 8.3% |
| 6 Months | 146 | 52.8% | 16.7% |
| 1 Year | 136 | 103.3% | 35.3% |
Alpha Algorithmics X-Factor™ – 20-Year Study
Average 1-year return: 85.1%
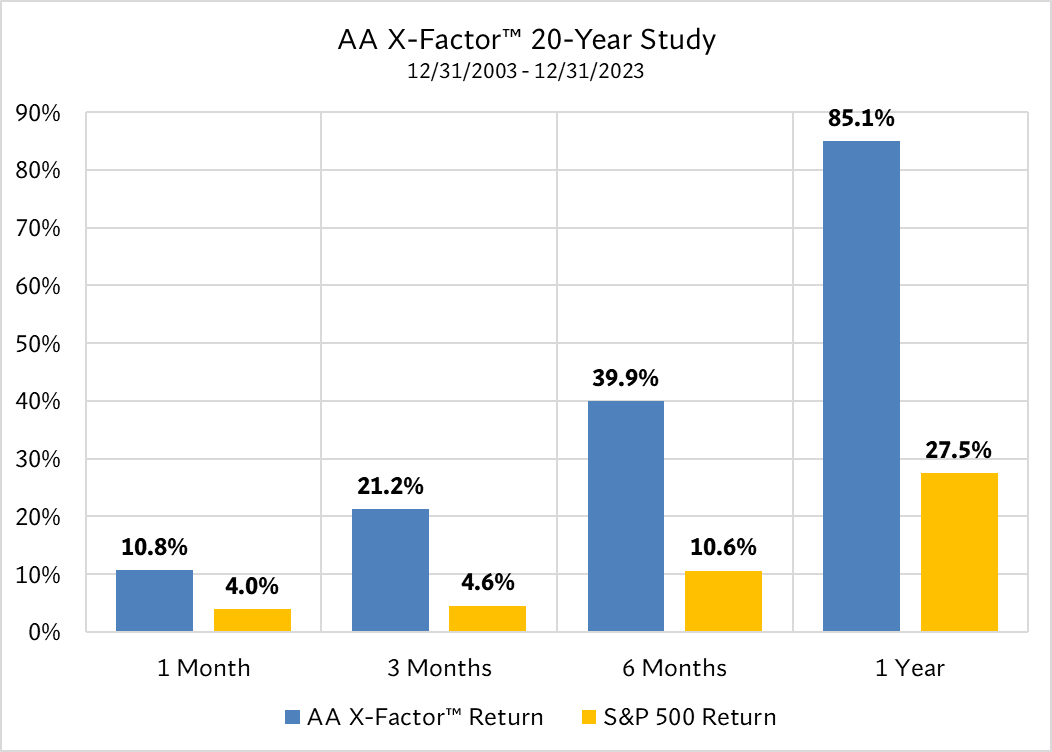
| Hold Period |
# of Co’s |
AA X-Factor™ Return |
S&P 500 Return |
| 1 Month | 175 | 10.8% | 4.0% |
| 3 Months | 174 | 21.2% | 4.6% |
| 6 Months | 173 | 39.9% | 10.6% |
| 1 Year | 165 | 85.1% | 27.5% |
Alpha Algorithmics X-Factor™ – 25-Year Study
Average 1-year return: 78.2%
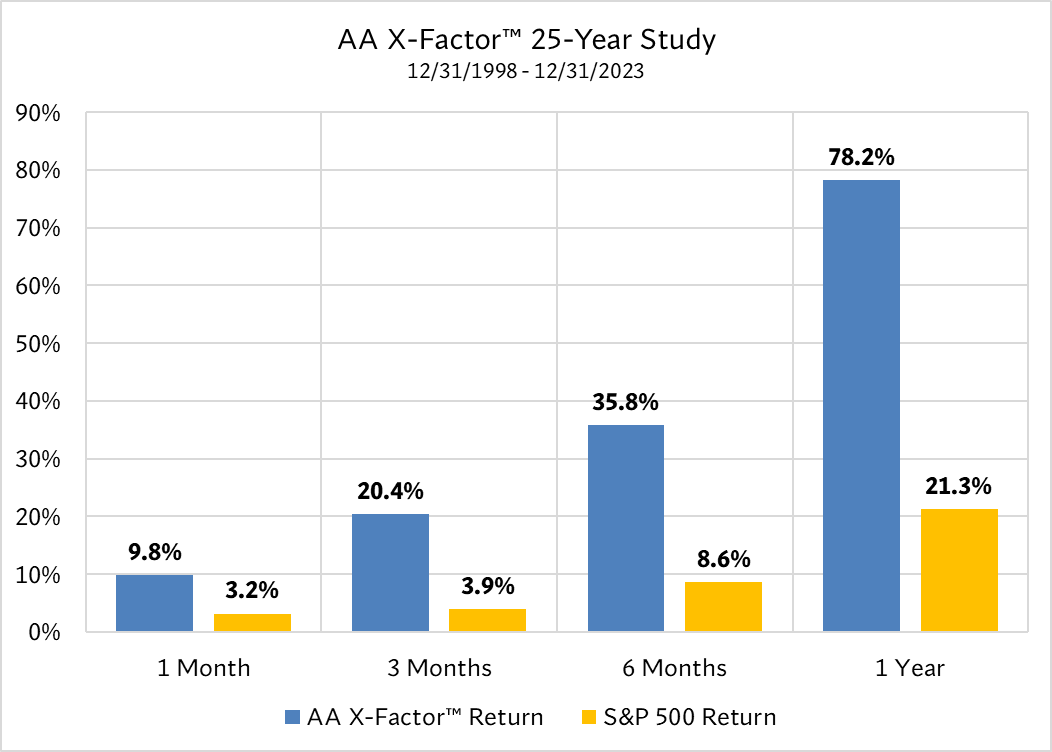
| Hold Period |
# of Co’s |
AA X-Factor™ Return |
S&P 500 Return |
| 1 Month | 195 | 9.8% | 3.2% |
| 3 Months | 194 | 20.4% | 3.9% |
| 6 Months | 193 | 35.8% | 8.6% |
| 1 Year | 185 | 70.2% | 21.3% |
ERS’s Micro-Cap Insight I™ (MCI I™) produced the results below in 4 historic studies:
Micro-Cap Insight I™ – 3-Year Study
Average 1-year return: 56.6%
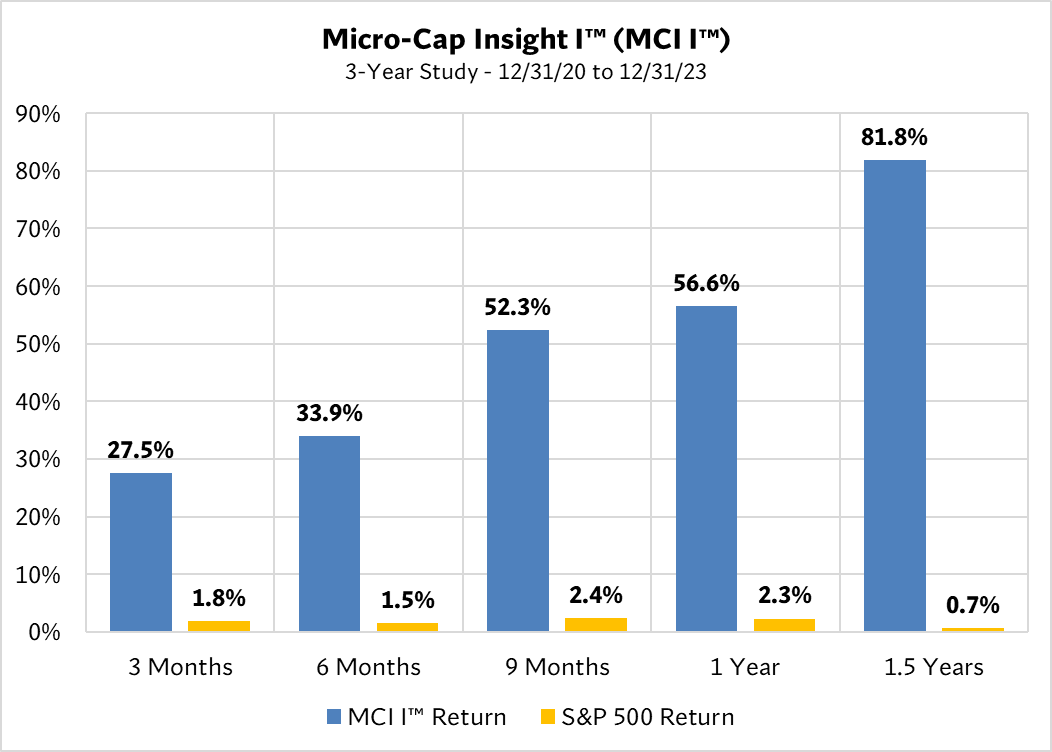
| Hold Period |
# of Co’s |
MCI I™ Return |
S&P 500 Return |
| 3 Months | 72 | 27.5% | 1.8% |
| 6 Months | 66 | 33.9% | 1.5% |
| 9 Months | 52 | 52.3% | 2.4% |
| 1 Year | 44 | 56.6% | 2.3% |
| 1.5 Years |
30 | 81.8% | 0.7% |
Micro-Cap Insight I™ – 5-Year Study
Average 1-year return: 89.5%
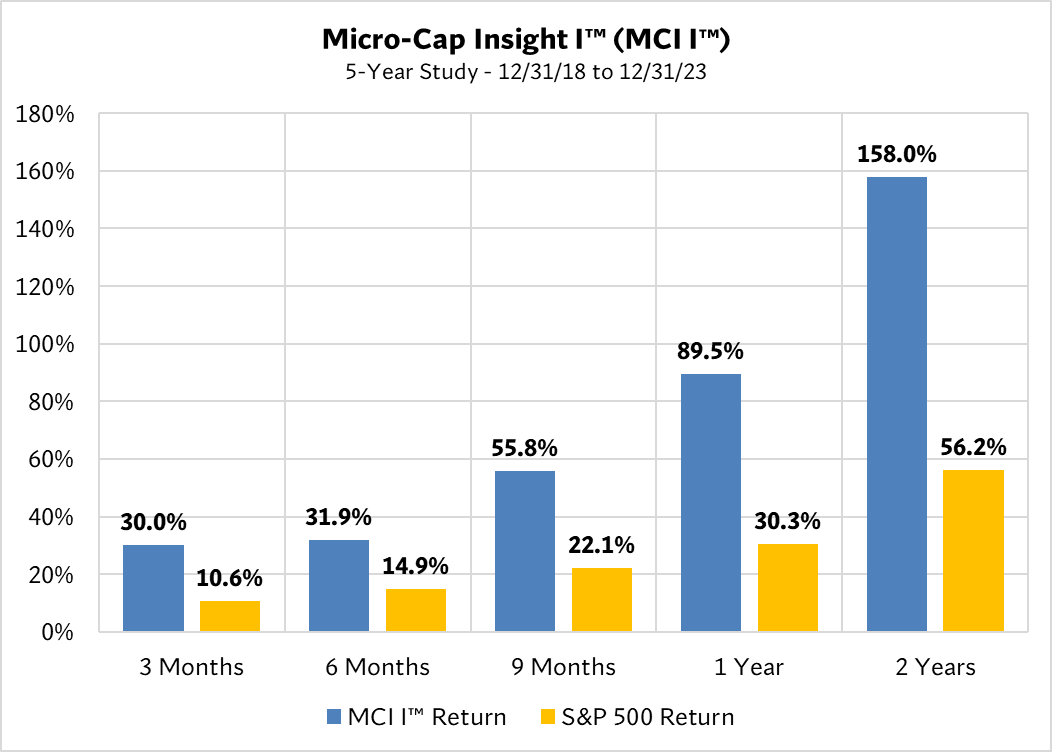
| Hold Period |
# of Co’s |
MCI I™ Return |
S&P 500 Return |
| 3 Months | 116 | 30.0% | 10.6% |
| 6 Months | 111 | 31.9% | 14.9% |
| 9 Months | 98 | 55.8% | 22.1% |
| 1 Year | 91 | 89.5% | 30.3% |
| 2 Years |
71 | 158.0% | 56.2% |
Micro-Cap Insight I™ – 10-Year Study
Average 1-year return: 56.0%
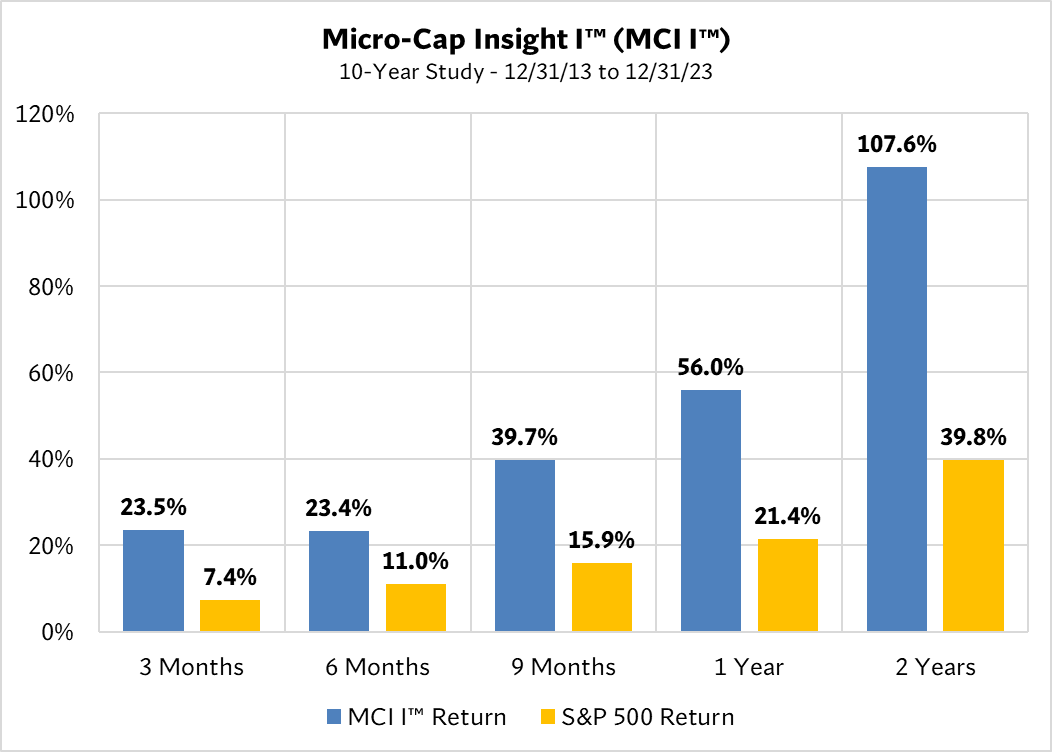
| Hold Period |
# of Co’s |
MCI I™ Return |
S&P 500 Return |
| 3 Months | 167 | 23.5% | 7.4% |
| 6 Months | 160 | 23.4% | 11.0% |
| 9 Months | 150 | 39.7% | 15.9% |
| 1 Year | 143 | 56.0% | 21.4% |
| 2 Years |
119 | 107.6% | 39.8% |
Micro-Cap Insight I™ – 25-Year Study
Average 1-year return: 38.0%
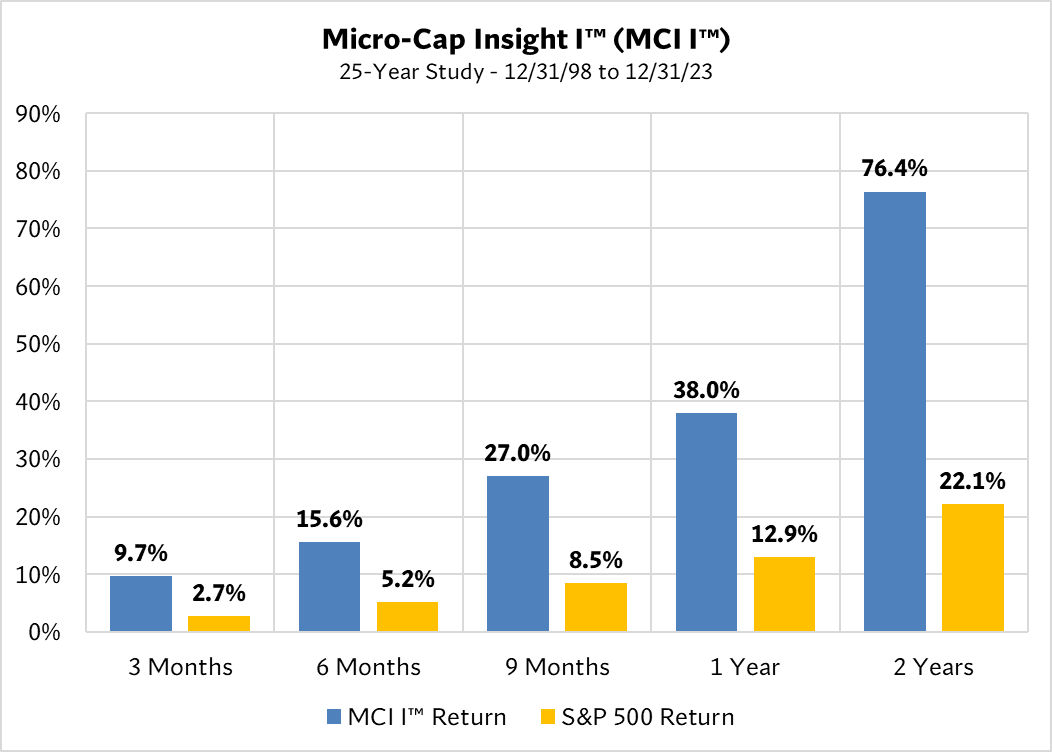
| Hold Period |
# of Co’s |
MCI I™ Return |
S&P 500 Return |
| 3 Months | 367 | 9.7% | 2.7% |
| 6 Months | 363 | 15.6% | 5.2% |
| 9 Months | 351 | 27.0% | 8.5% |
| 1 Year | 347 | 38.0% | 12.9% |
| 2 Years |
328 | 76.4% | 22.1% |